0
Table of Contents
What are dashboard design principles?
Dashboard design is a popular topic among many designers, and it's easy to see why. Dashboards are an excellent way of presenting data in an easily digestible format that can be used for both business and personal use.

Dashboard design is a popular topic among many designers, and it's easy to see why. Dashboards are an excellent way of presenting data in an easily digestible format that can be used for both business and personal use. Have you ever gone to your dashboard and found it cluttered, difficult to navigate, or just not aesthetically pleasing? It can be a frustrating experience. Luckily, there are a few principles of design that can help you create an effective dashboard. This blog post will introduce you to some best practices for designing both beautiful and functional dashboards.

Does your website meet your conversion benchmarks?
Not quite? We have solutions to get you there.
Learn moreHow do you design a dashboard?
The first thing to consider is what information you want to show on it? What do you want the end-user to see? Your dashboard should have a specific function or goal in mind that it needs to achieve when designing it - this will help you focus on what you need the data for rather than being distracted by other irrelevant information.
By the way, have you ever wondered which framework developers use most frequently for mobile app development? Why choose Xamarin or Flutter for mobile apps? And why, among so many mobile app development frameworks, choose React Native? Be sure to check out our blog posts on these topics.
Next, think about how much space you need for each piece of information and where it should go on the page. You'll also need to decide if you want any graphs or charts in your dashboard - this will depend on what types of data you're trying to convey. Finally, make sure that the colors and fonts are easy-to-read and not distracting from the data.
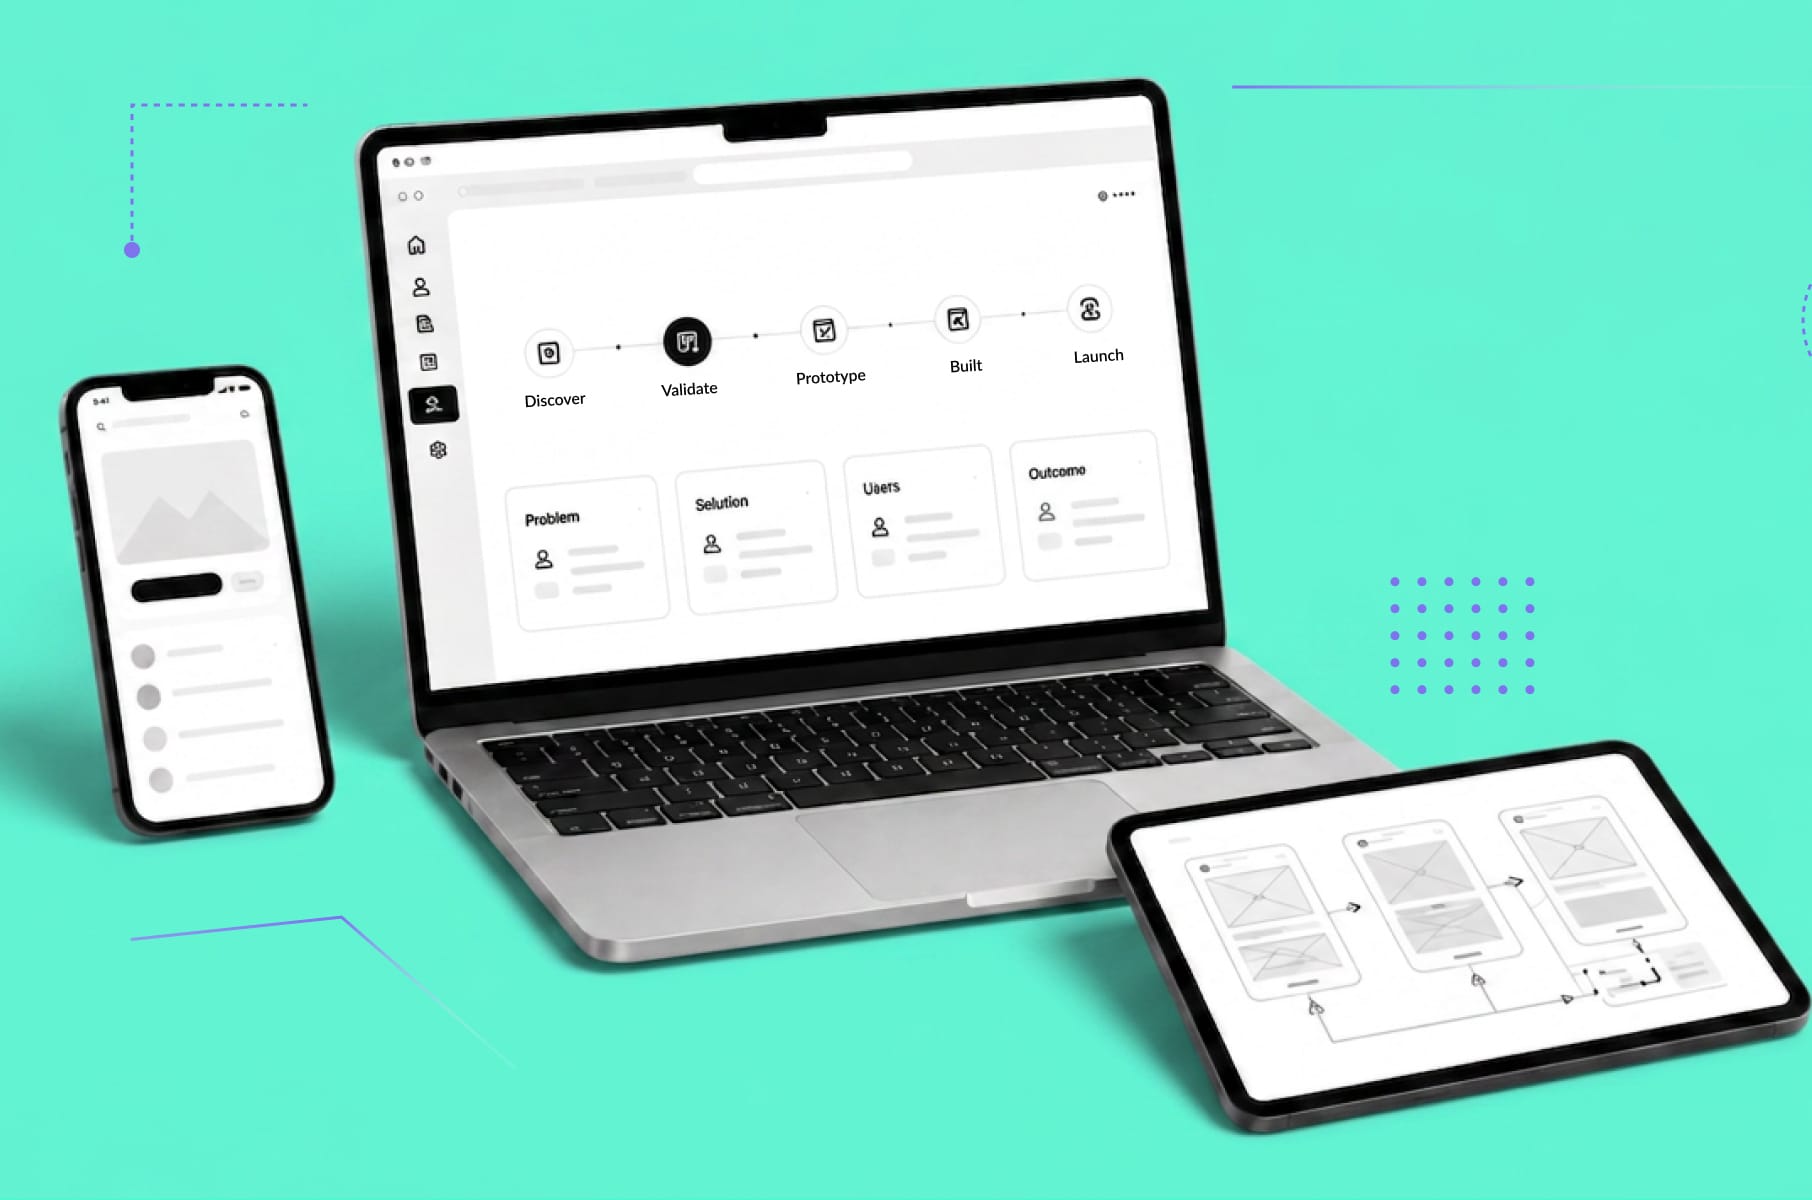
Follow these five steps while designing your dashboard:
1) Identify the problem you are trying to solve and the audience for whom you are designing this dashboard.
2) Create a list of all the information you want to show on your dashboard;
3) Organize your information into sections or categories;
4) Design your layout and choose colors that match your goals and audience;
5) Test your design by going through each section one by one and asking yourself if everything is clear. If not, tweak it until it is;
Good dashboard design principles:
There are many types of dashboards: financial, operational, marketing and sales, and more. It's important to know the kind of dashboard you want to design before you start brainstorming ideas or considering colors or fonts. The design principles for dashboards will vary depending on what they are being used for. Still, some general guidelines can be applied universally across all types of dashboards. A good way of designing a dashboard is by using these key principles:
Keep it simple
Dashboards need to be easy to understand at a glance. Don't put too much information on them or use complicated graphs and charts. This is especially important for dashboards with lots of information, as too much information will overload the user and make them less likely to take any action. Instead, focus on using clear icons, text, and color-coding so that people can quickly see what they need.
Be consistent
Consistency is key when designing dashboards as this will help people navigate your system easily and feel confident that they know where they are going. If you want to make sure that all your data points are comparable, then it is best to have them displayed consistently across all dashboards.
Think about functionality
It's not enough just to have functional dashboards; you also need them to function well. This means that each element should serve its purpose without being overly distracting. Allow users to customize their dashboards according to their needs by providing different views of the same data.
Provide clear visual cues
This principle focuses on how data is presented in order to make the information more accessible. It's about ensuring that people can identify what they want without having to click through several screens or pages of information. Provide a clear call to action. For example, if you want your customer to take a survey or purchase something from your website, you need to be transparent about what they should do next.
Think about users
It is essential to consider how people will use the dashboard when designing it. For example, if you are using a large screen that can be seen from across the room, then you should use bigger fonts and icons in order to make them easily visible. If your dashboard is designed for mobile devices, you should include graphs that are easy to read on smaller screens.
Use color
The use of color can be very effective for conveying meaning and distinguishing different elements from one another. Use color to highlight key points - this is particularly useful if you have large amounts of data on your dashboard, as people will find it easier to focus on one section at a time if they can distinguish between different sections using colors. Colors should be used sparingly, but when they are used properly, they can make an interface more intuitive and easier to understand.
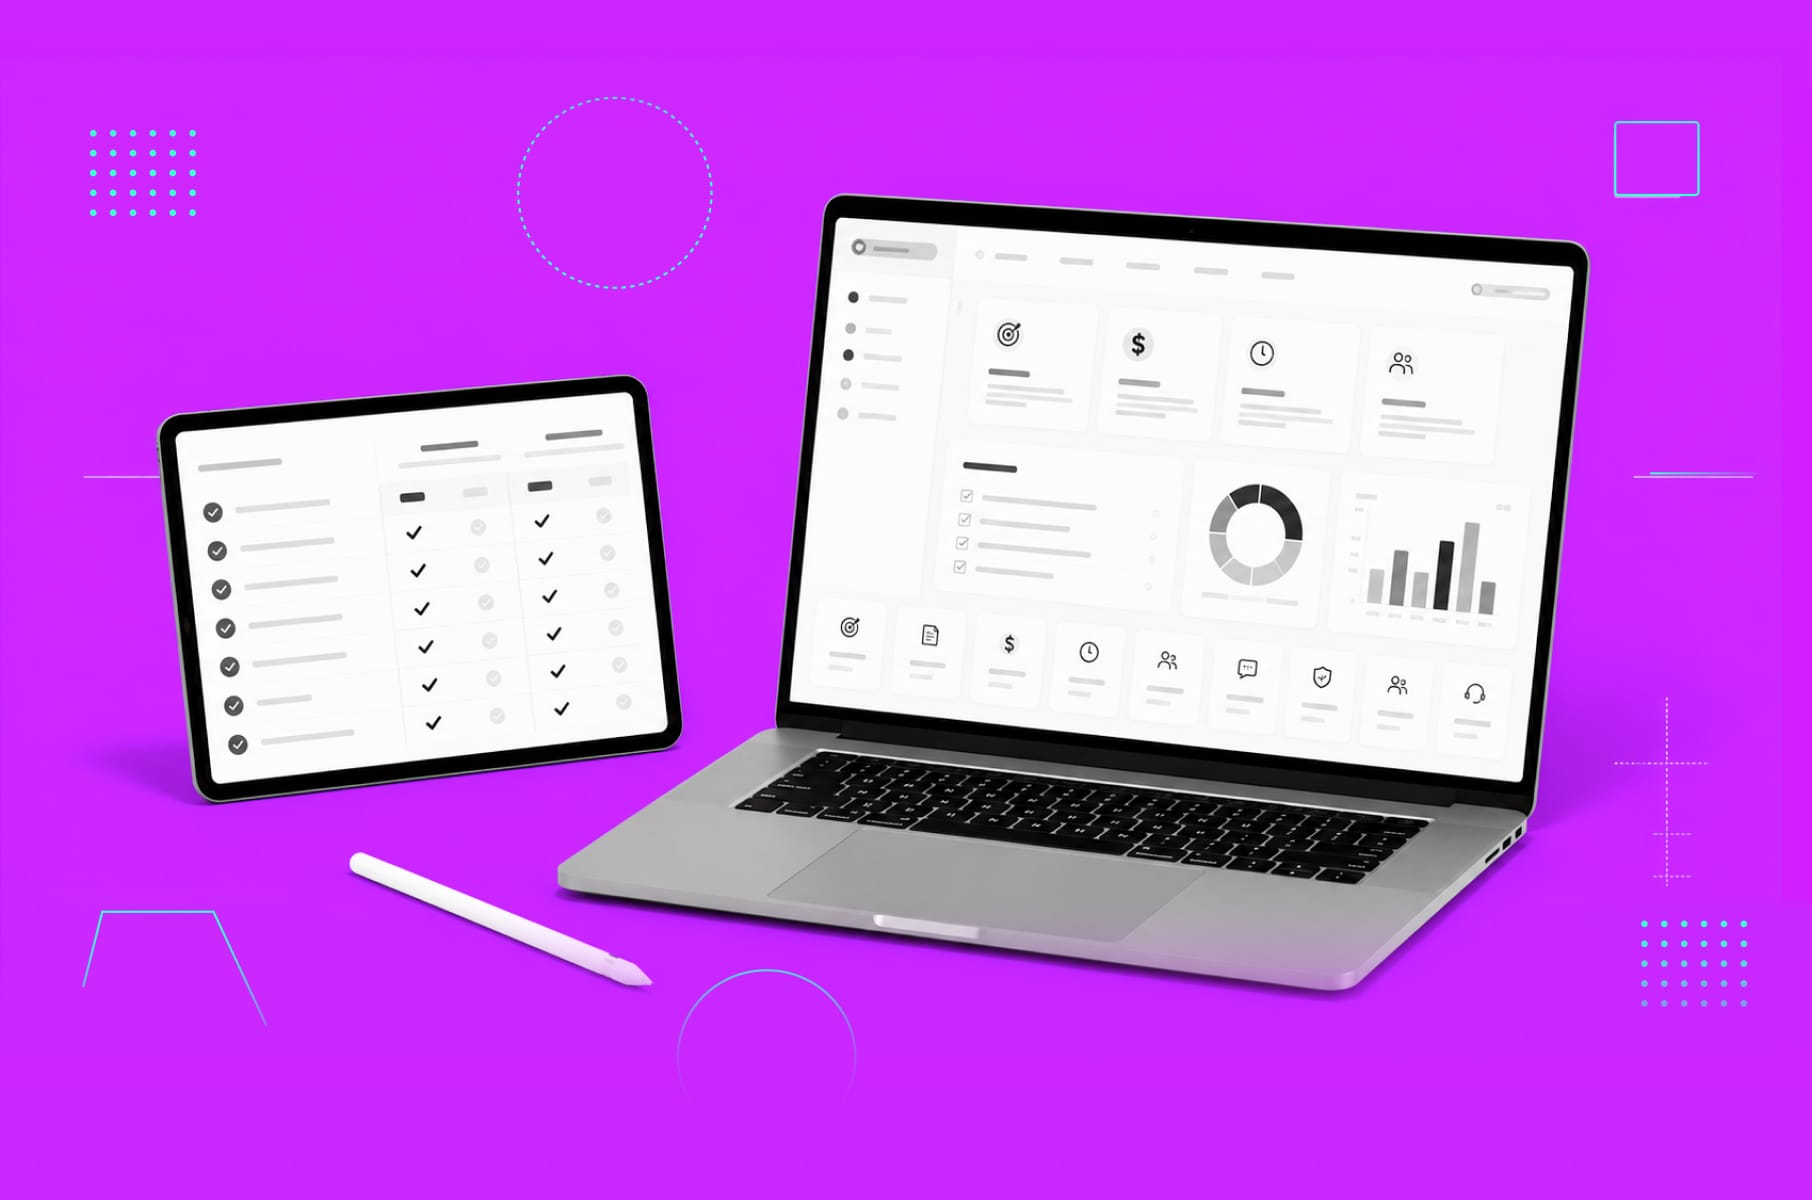
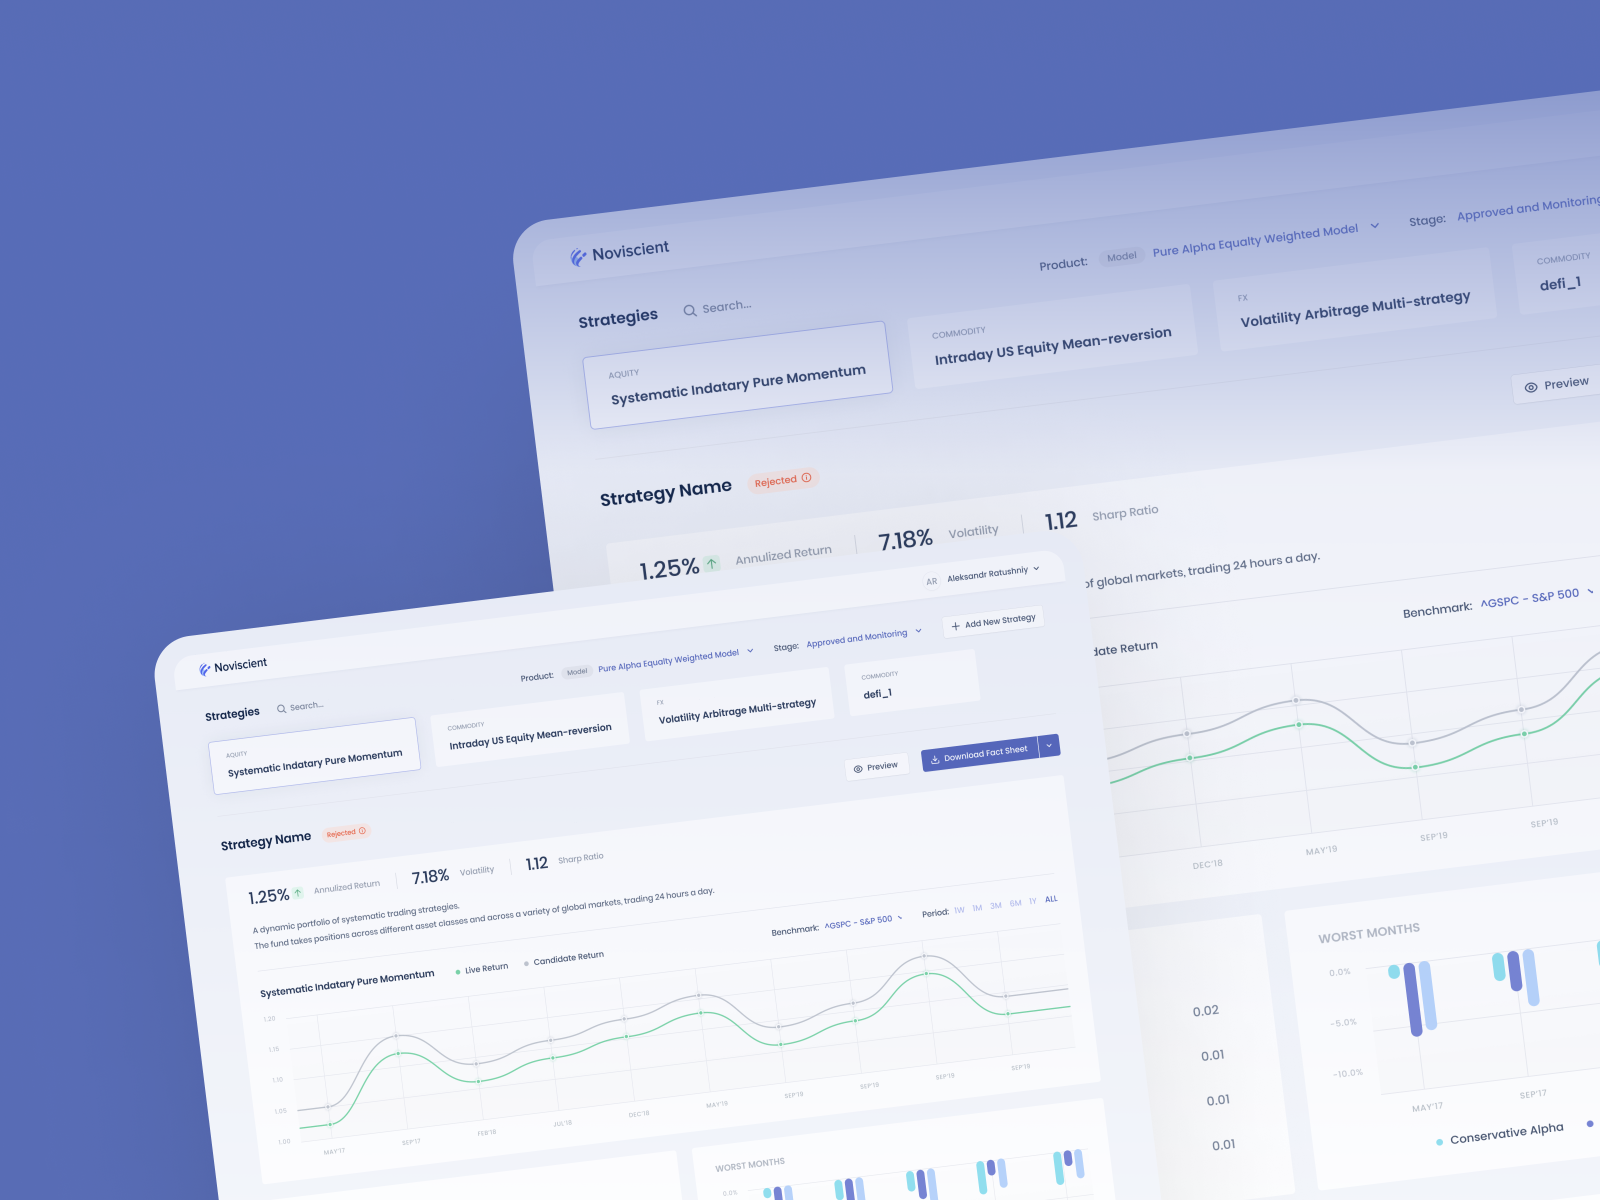
Best dashboard design inspiration
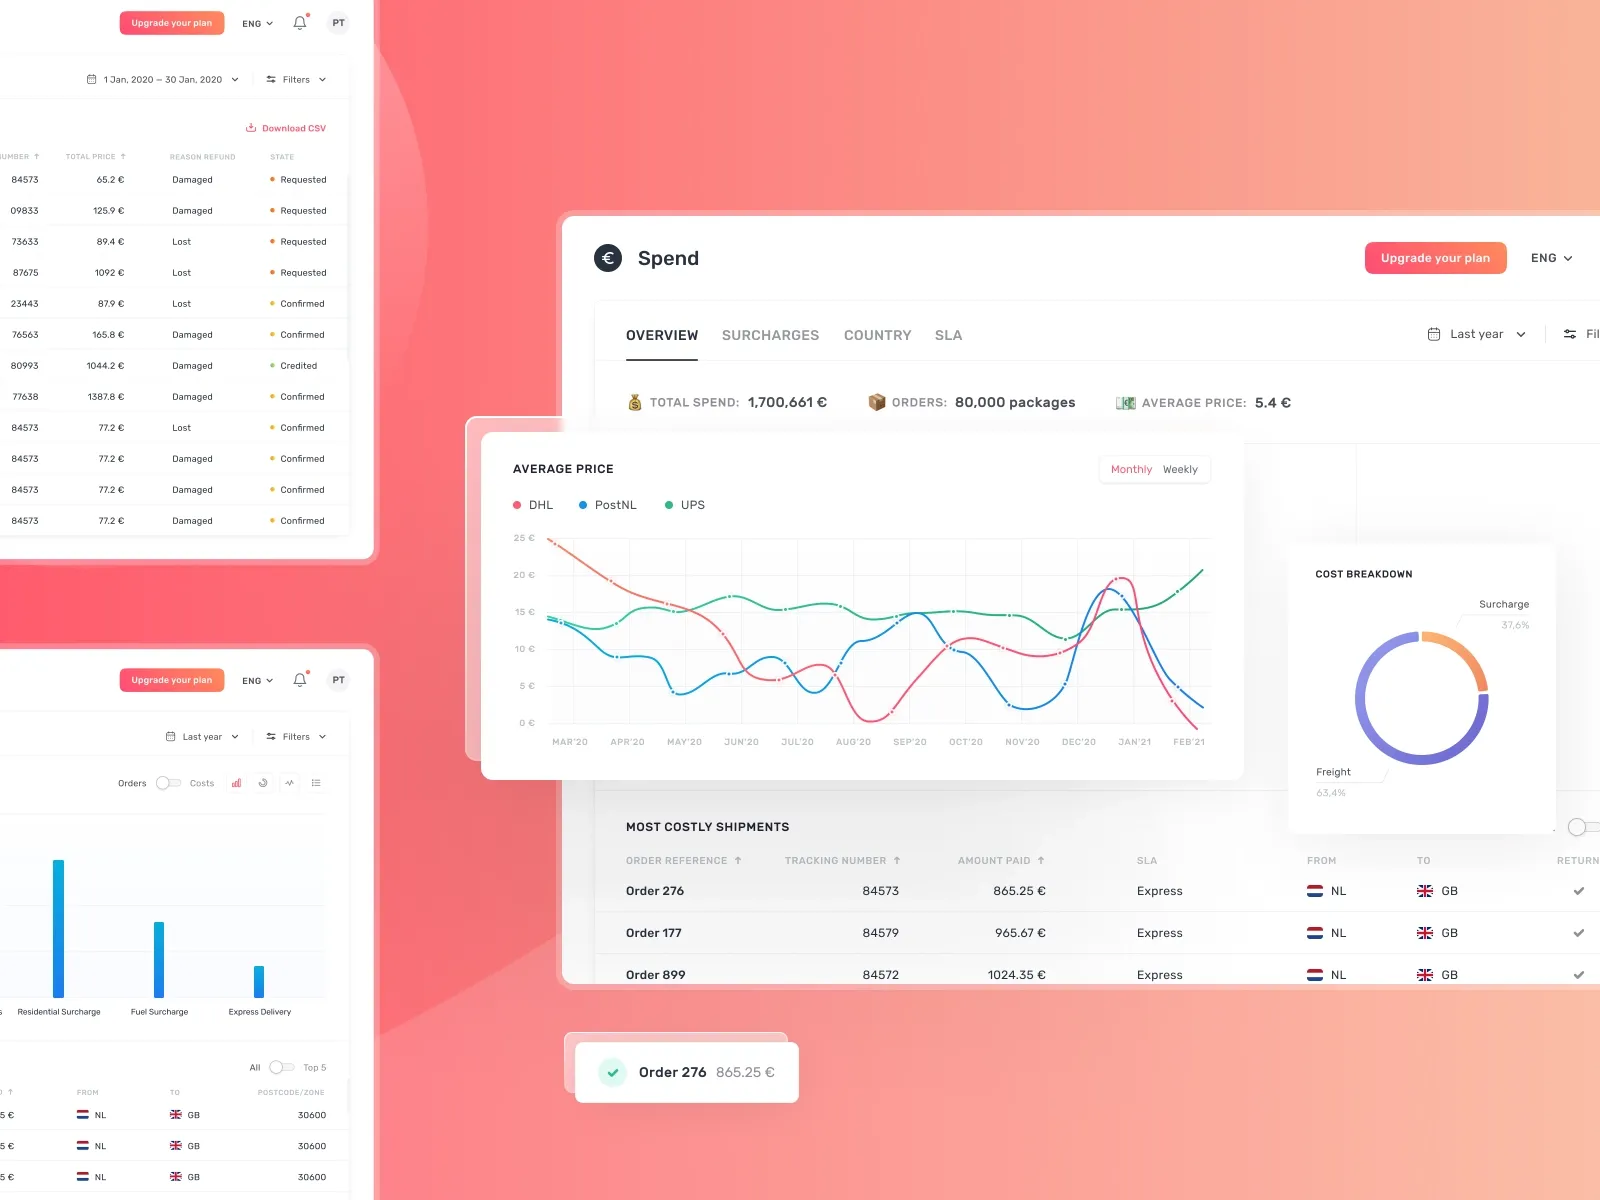
The most popular dashboard type is the data dashboard. It is a visual representation of the most important information for an organization. It is typically designed to provide quick answers to key questions that are specific to the organization's goals and objectives. A data dashboard can take many forms, depending on how it will be used. Dashboards can also vary in terms of what type of data they present, such as financial metrics or customer analytics. People use them to monitor and measure business data. They're also used to show progress over time, identify trends, and forecast future performance.
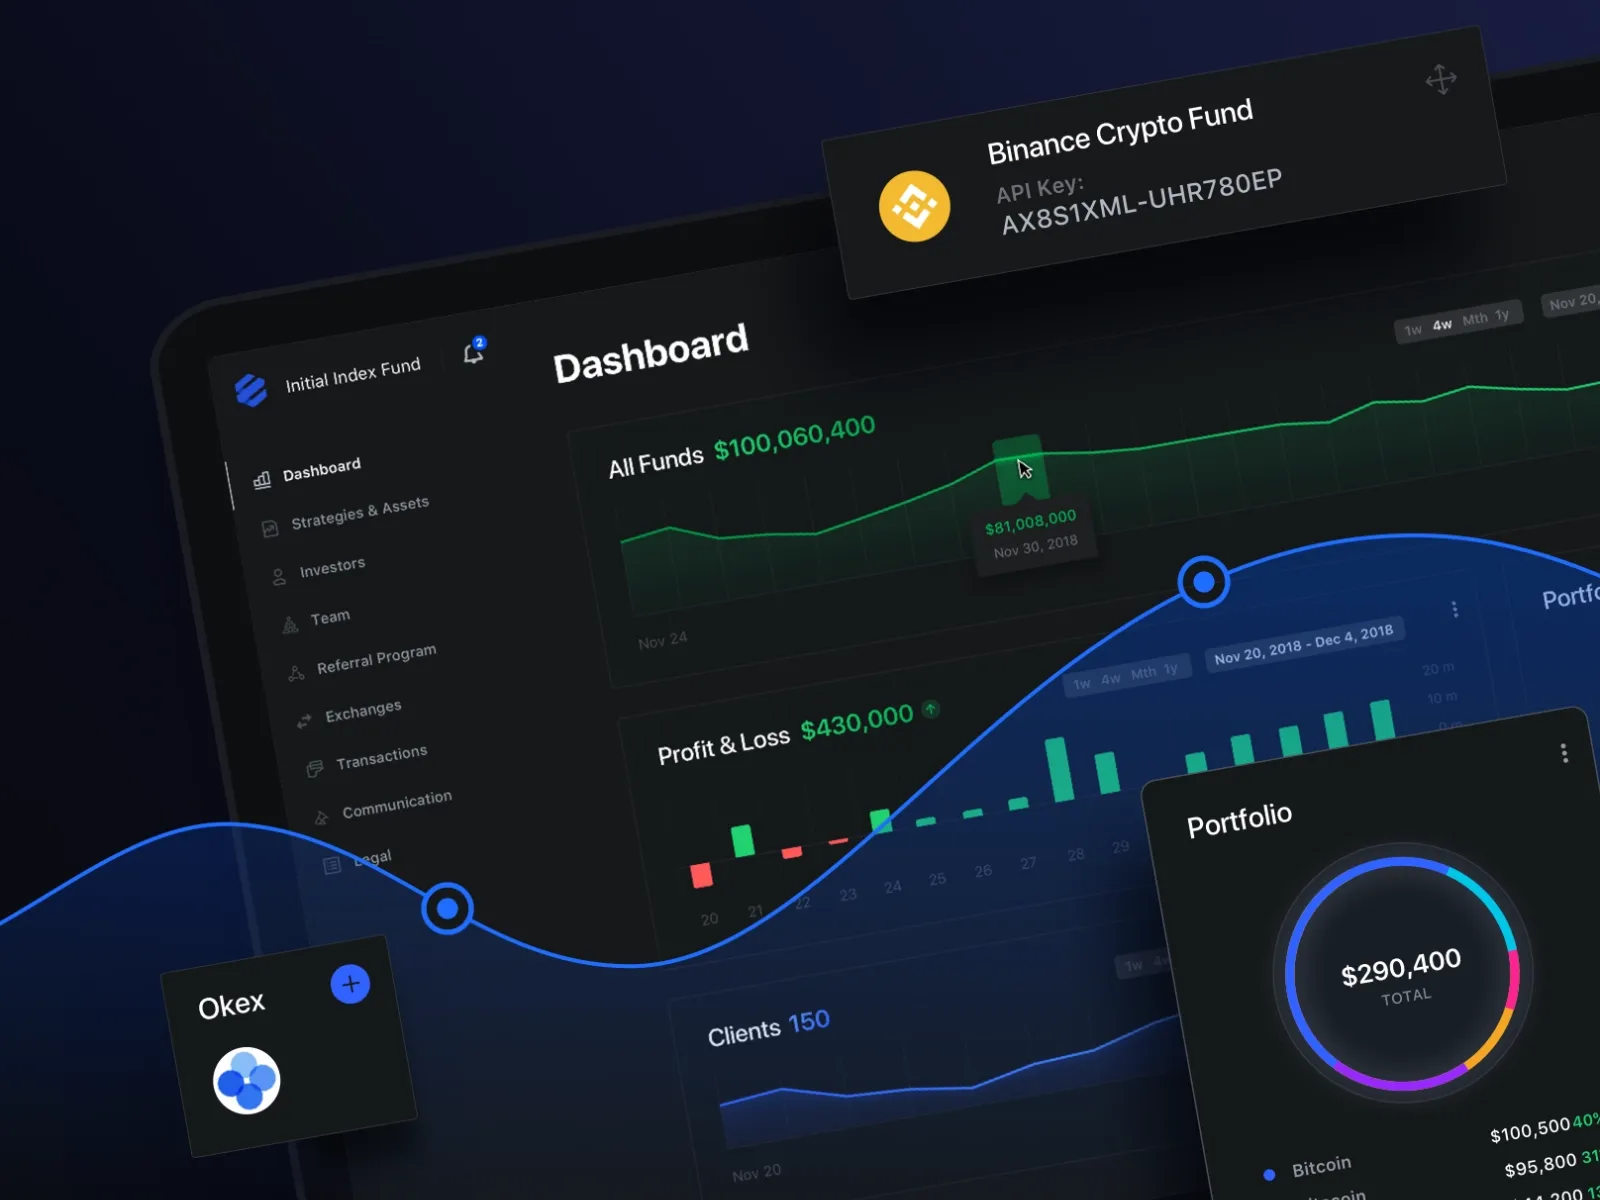
Another type is a management dashboard which has more features than a data dashboard. A management dashboard is a tool that shows how well an organization is performing in relation to its goals and objectives. Management dashboards are typically created for senior managers who oversee multiple aspects of an organization or project. These managers require information about people, processes, projects, metrics, budgets, risks, etc., all on one screen to make the decisions easier.
Analytical dashboards are created to provide insights into what is happening at any given time for an individual or company to make informed decisions. They are usually focused on presenting static data that has been collected over months or years. They are often used to allow managers to view trends over time and compare different sets of data. An analytical dashboard typically contains the same metrics as the data dashboard, but it also includes a more detailed analysis and explanations about what those numbers mean.
Wrapping up
With a dashboard, one can easily get a quick overview of key information without going through multiple screens or pages. If well-designed, they provide clarity and insight into the workings of the business. If the essential information is not displayed on the dashboard, it is as good as useless. So dashboard design principles are necessary to get right.