0
Table of Contents
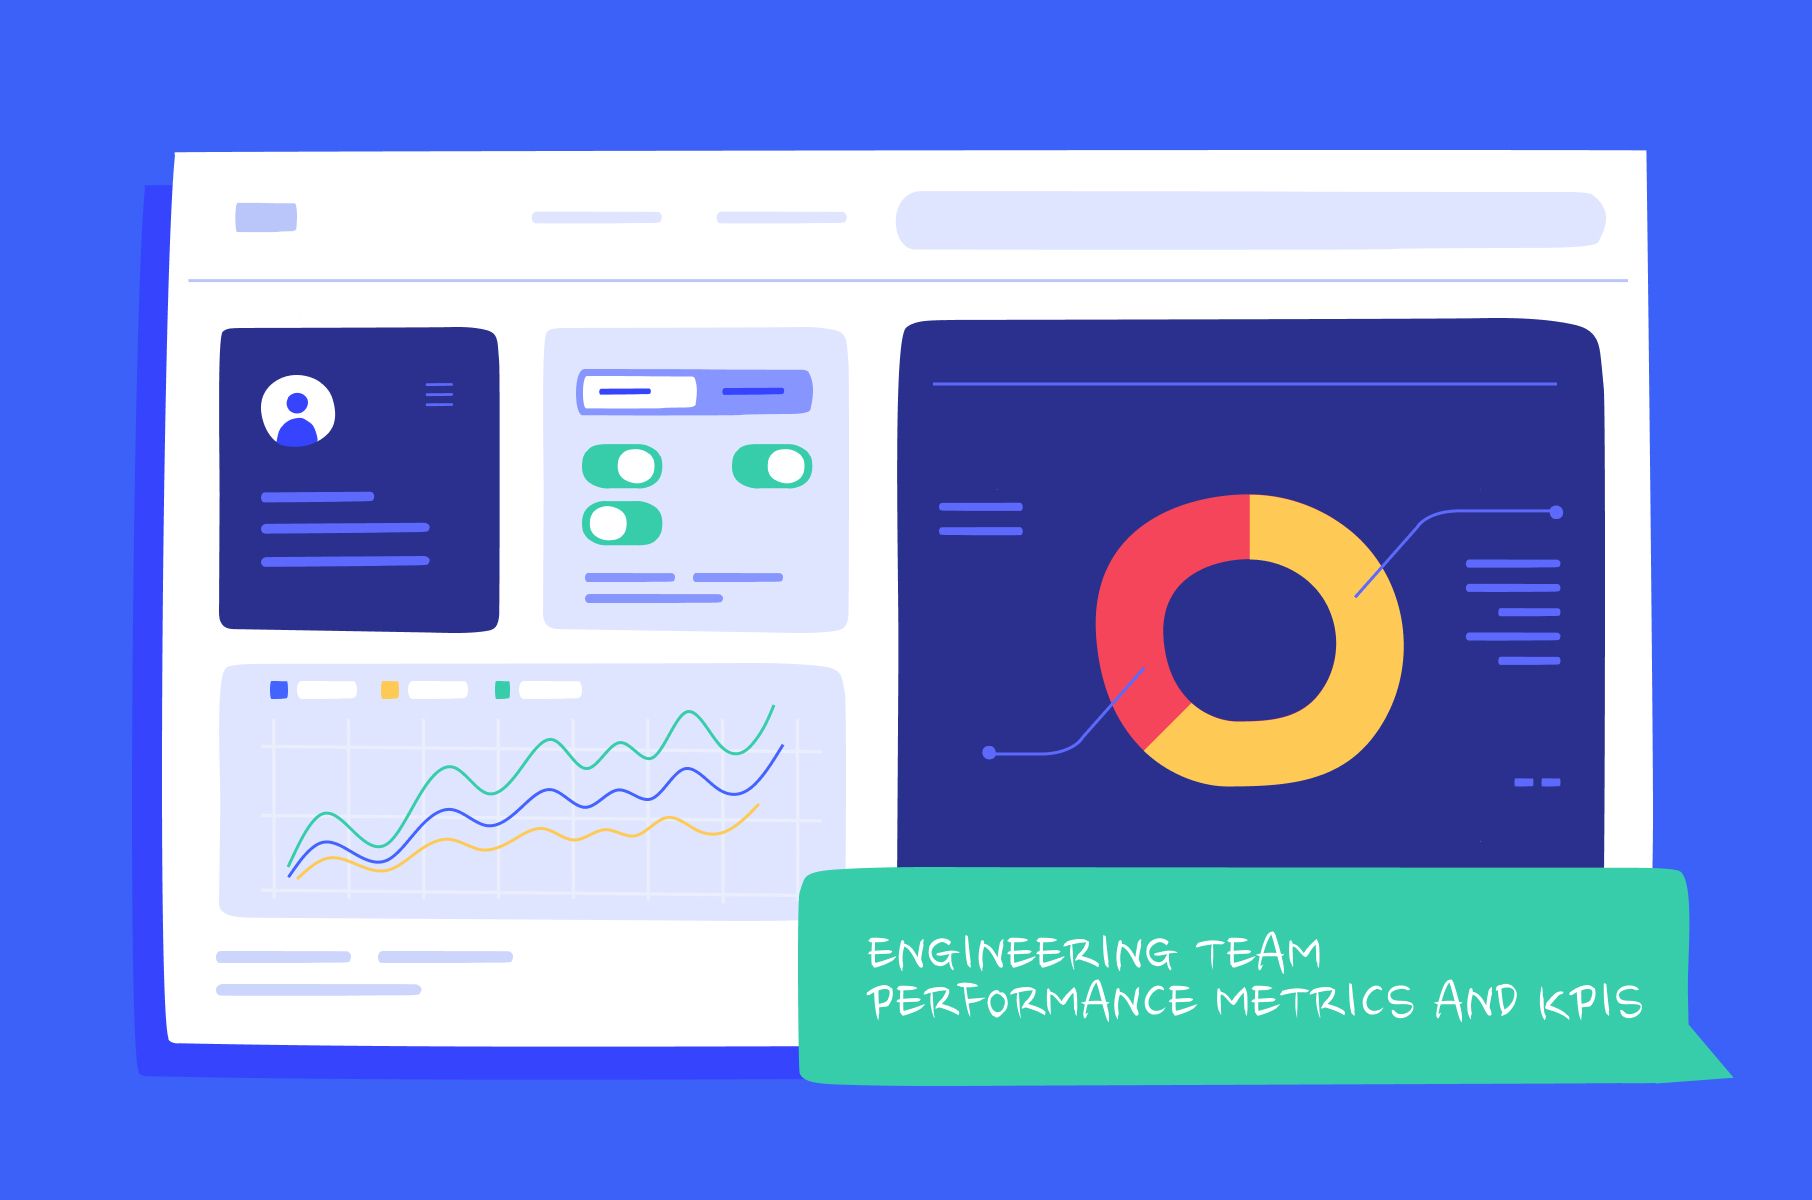
Measuring success: top 10 engineering team performance metrics and KPIs
Teams need to measure their progress and success, performance metrics and KPIs provide a way to do this. So, let’s now learn how to properly measure success in your engineering team.
Measuring performance in engineering teams can be boiled down to tracking specific performance metrics and KPIs. Some common metrics include code quality KPIs, lead time, commit risk, etc.
However, metrics alone do not tell the whole story. You have to consider the nuances and complexities of scaling engineering teams and the engineering process itself, as well as the unique dynamics of each individual team.
Take it from a frontend web development company, a holistic approach to performance evaluation, taking into account factors like team morale, work-life balance, and employee satisfaction, is a much better idea. Then, combined with the metrics we mention in this article, you’ll be able to fully understand how your team is doing.
So, let’s now learn how to properly measure success in your engineering team. Don’t forget to stay tuned for more exciting and useful pieces. Perhaps on scalable Node.js architecture?

Want to have an efficient, business-oriented design?
View a recorded webinar with Pavel Tseluyko on how design adds value to your business.
Watch nowWhat are performance metrics and KPIs in engineering
Performance metrics in engineering are numerical values or measurements that are used to evaluate the effectiveness and efficiency of an engineering team or project. KPIs are a subset of performance metrics most critical to the project's success, measuring the success of a specific goal or objective.
Both help ensure that the project is aligned with the overall strategy of the organization, and they are typically focused on areas such as productivity, quality, cost, and schedule and are used to track progress, identify areas for improvement, and make data-driven decisions.
Benefits of using performance metrics and KPIs
There are several benefits of using performance metrics and KPIs in engineering. First of all, they help measure a project's progress and give insight into its success, allowing timely interventions and adjustments to be made if necessary.
They also make way for more data-driven decision-making by providing quantitative data that can be used to make informed decisions, which, in turn, allows for more efficient and effective decision-making that relies less on guesswork or intuition.
Here are a few more advantages of using performance metrics and KPIs:
- Improved efficiency;
- Better performance tracking;
- Improved communication;
- Better focus on objectives;
- Continuous improvement in processes and outcomes;
- Improved accountability.
Key performance indicators for engineering teams
The following types of metrics are the most telling.
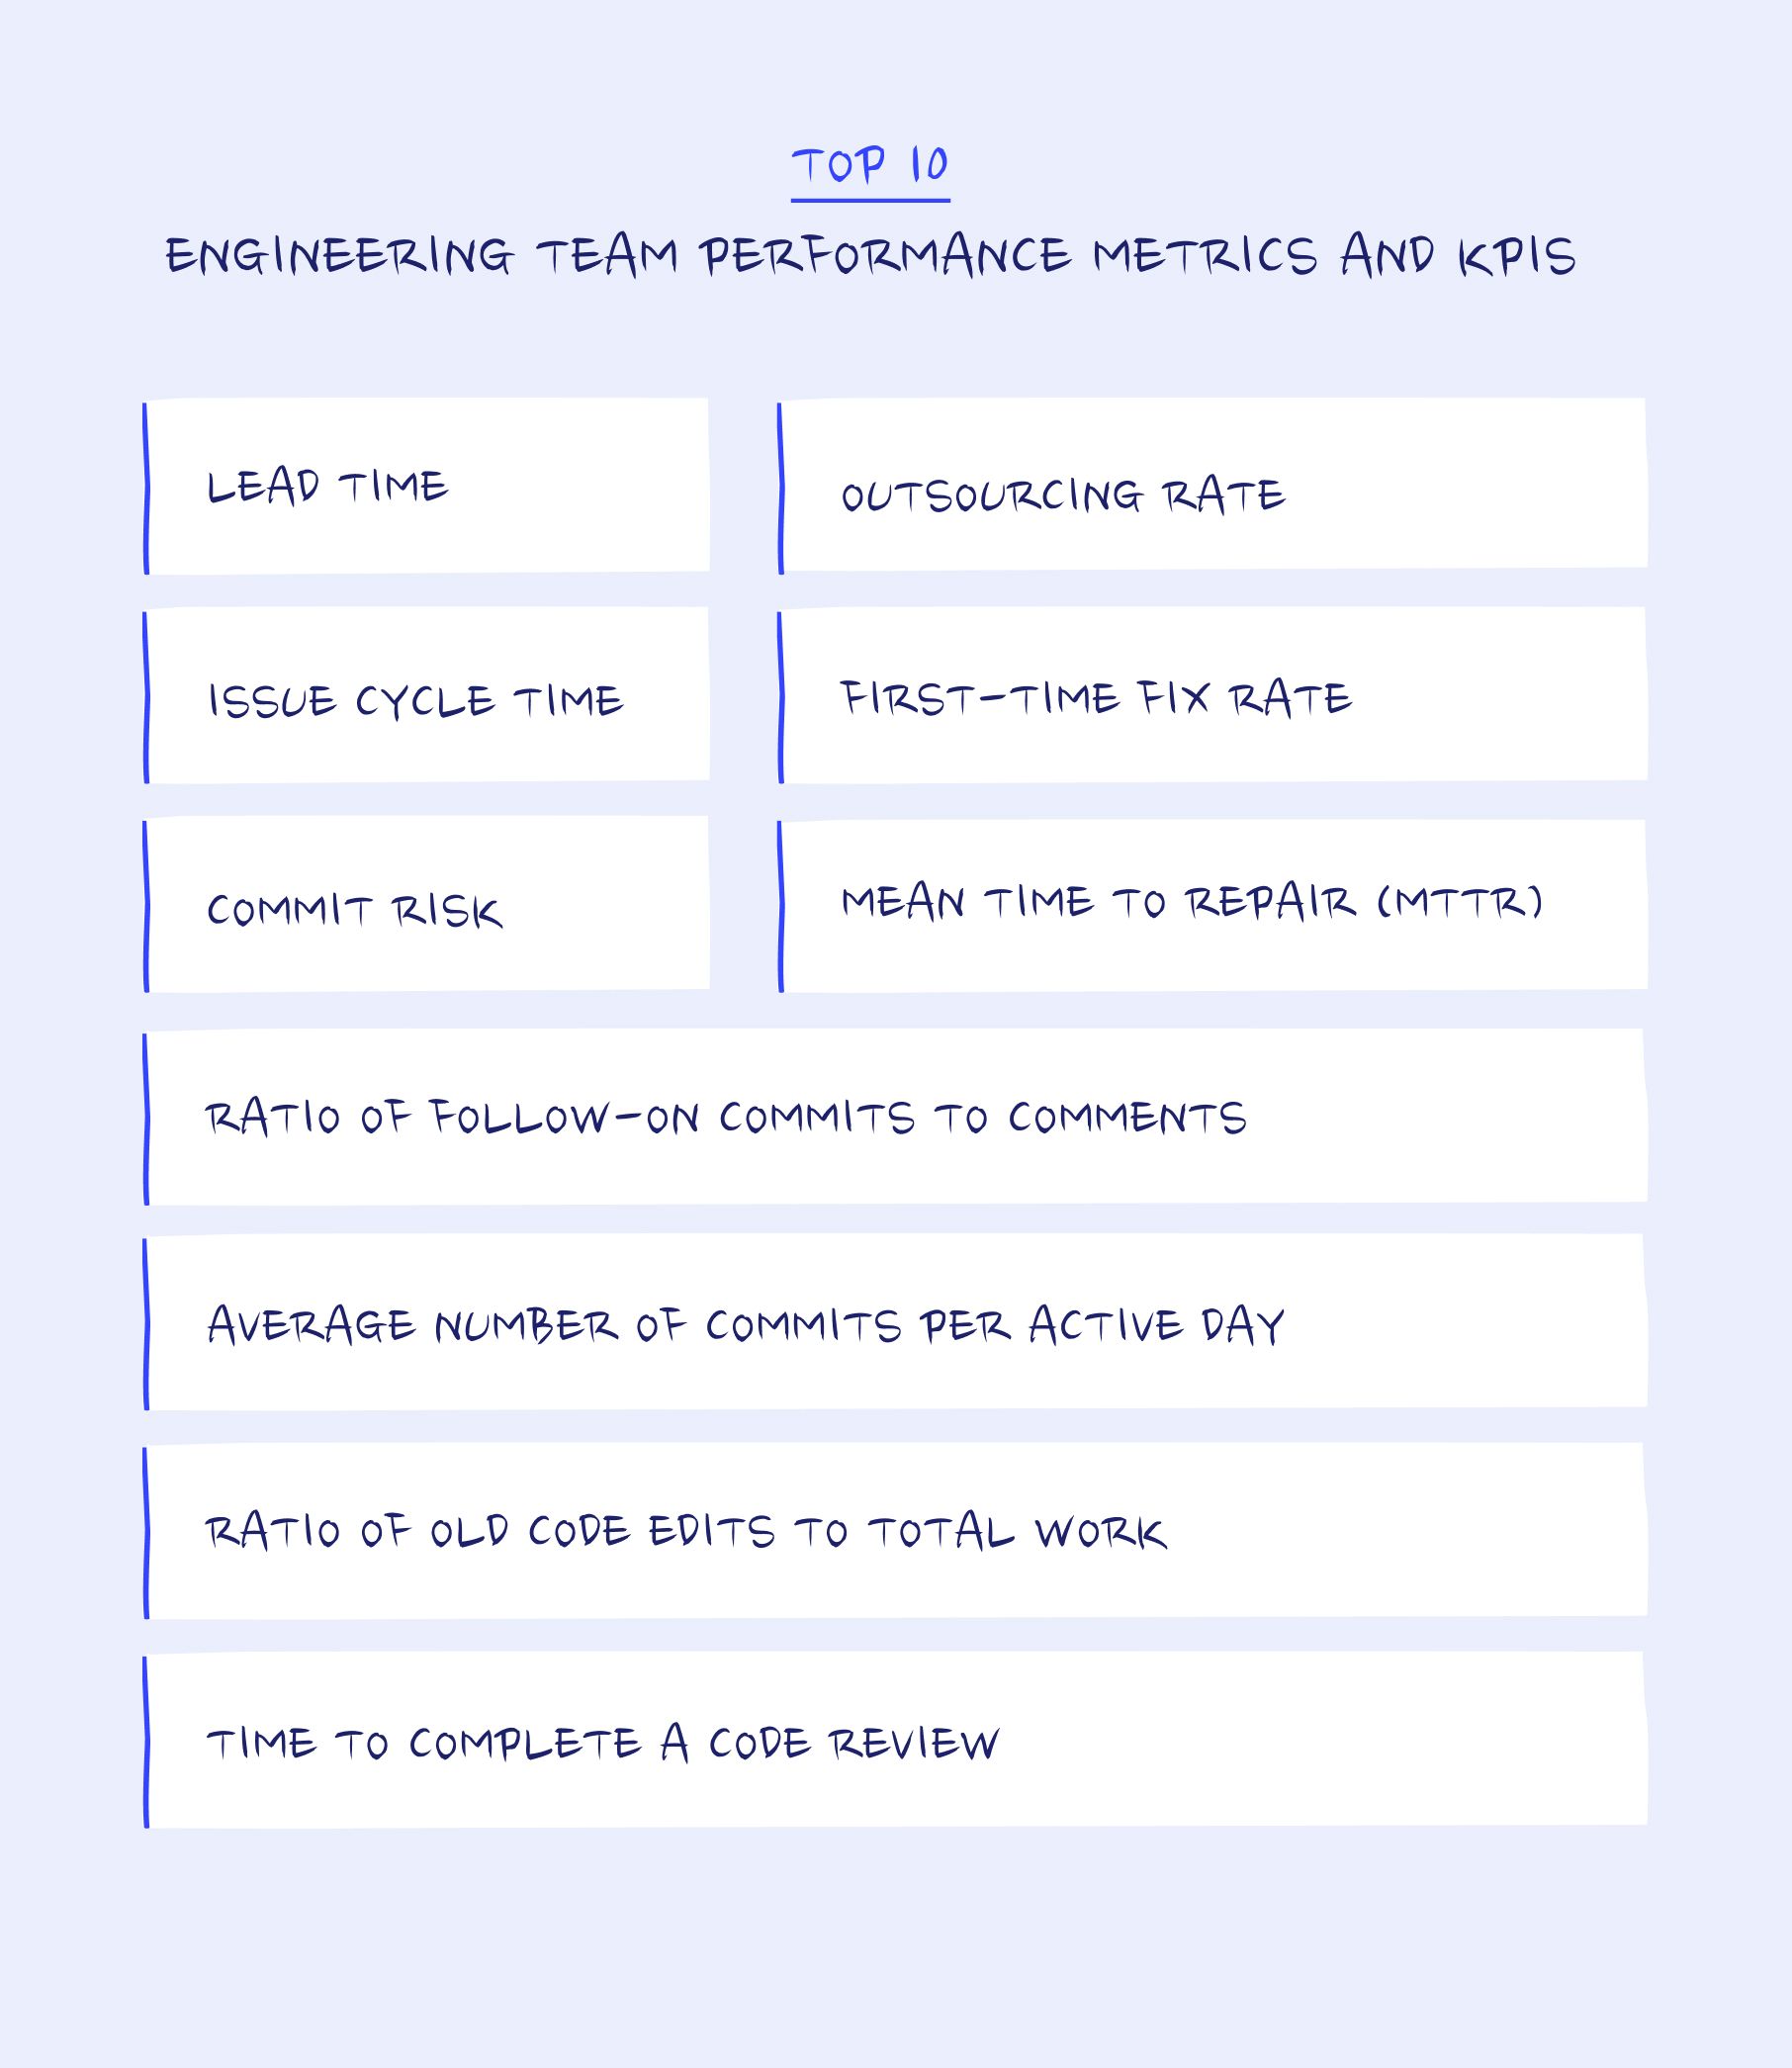
Lead time
Lead time is the duration between starting and completing a project or task that helps measure the time taken to deliver products or services. For example, reducing lead time can help teams to improve their time-to-market for new products and increase customer satisfaction.
Lead time can also be used to measure the efficiency of a team's processes and identify areas for improvement. By breaking down the lead time into different stages of the project or task, teams can identify bottlenecks and areas of inefficiency and take action to address them.
Issue cycle time
Standard cycle time refers to the time it takes to complete a specific task or process from start to finish. Issue cycle time, on the other hand, measures the time it takes for engineering teams to resolve issues or bugs in their products or services.
By tracking both cycle times, engineering teams can identify areas of inefficiency in their processes and work to address them. Reducing issue cycle time can also help teams to improve their time-to-market for new products, reduce costs, and improve customer retention.
Average number of commits per active day
This one measures the frequency of code changes or updates made by developers in a given time period and is calculated by dividing the total number of commits made by the total number of active days worked by developers.
This KPI is important as it helps to measure the productivity and efficiency of software development teams. A high number might indicate that developers are making frequent code changes and updates, which could suggest they are productive and working efficiently.
Ratio of old code edits to total work
This ratio measures the percentage of time spent making changes or edits to existing code versus writing new code from scratch by dividing the total time on editing existing code by the total time spent on all development work (including both new code and code edits).
A low ratio of old code edits to total work could indicate that developers spend more time on new code, which could signify a healthy development process. A high ratio could be a sign of technical debt or a lack of focus on innovation.
Commit risk
Next metric measures the potential impact or risk of a code change or update made by a developer and is typically calculated based on various factors such as the size of the code change, the number of files affected, the complexity of the code, and the potential impact on other parts of the software system.
This KPI helps software development teams to identify high-risk code changes that could cause bugs, crashes, or other issues in the software system. By tracking commit risk, teams can prioritize code reviews and testing efforts for high-risk code changes and potentially avoid or mitigate problems before they affect users.
Time to complete a code review
The following KPI estimates the average time it takes for a code change or update to be reviewed by other development team members. It includes the time from when the code change is submitted for review to when it is approved, rejected, or returned with feedback.
This one is important as it helps software development teams ensure that code changes are reviewed on time and that feedback is provided promptly. It also helps identify bottlenecks or delays in the code review process and take steps to address them.
Ratio of follow-on commits to comments
This ratio assesses the effectiveness of the code review process by tracking the ratio of follow-on commits made after code review comments to the total number of comments made during the review process.
A high ratio of follow-on commits to comments indicates that the review process effectively identifies and addresses code quality issues, while a low ratio may indicate that problems are being missed or not adequately addressed.
Outsourcing rate
This next rate means the percentage of work outsourced to third-party vendors or contractors compared to the total amount of work performed by an organization, helping monitor the outsourcing activities and the associated costs.
A high outsourcing rate can indicate that an organization is successfully leveraging the expertise and resources of third-party vendors but may also indicate a lack of internal expertise, over-reliance on outsourcing, or a failure to effectively manage vendor relationships.
On the other hand, a low outsourcing rate may indicate that an organization can perform most of its work internally but may also show a missed opportunity to leverage the expertise and resources of third-party vendors.
First-time fix rate
This is a measure of how often a problem or issue is resolved on the first attempt without the need for additional follow-up. A high first-time fix rate indicates that the engineering team is efficient and effective at problem-solving.
However, a low first-time fix rate can indicate underlying issues with the team's processes or training, such as inadequate tools or training, poor communication or collaboration, or lack of knowledge and expertise.
Mean time to repair (MTTR)
This last one is a measure of how long it takes to repair a system or device after a failure or breakdown. By tracking MTTR, engineering teams can identify areas where improvements can be made to minimize downtime and maximize productivity.
It is calculated as the average time it takes to repair a system or device after a failure or breakdown has occurred. By reducing MTTR, engineering teams can reduce the amount of time that production is offline, which can significantly impact overall productivity and profitability.
What are the best tools to measure software metrics in engineering?
In our team’s opinion, these four tools are best at measuring engineering performance.
Hatica
Hatica is an easy-to-use software metrics tool that provides real-time insights into your engineering team's productivity and code quality. It analyzes data from your code repository, project management tools, and other sources to help you identify areas for improvement and optimize your team's performance.
Hatica's best features include its ability to provide real-time actionable insights, customizable dashboards, and integration with popular project management tools. It also helps identify potential bottlenecks and productivity blockers and provides valuable metrics such as cycle time, lead time, and throughput.
Sleuth
Sleuth focuses on showing the impact of code changes on your application's performance and stability. It also tracks builds and deployments and helps you identify the root cause of any issues that arise.
Sleuth offers the ability to detect code changes that may cause issues, an intuitive dashboard, and integration with popular DevOps tools. It also provides valuable insights into code changes and their impact on performance and helps identify and fix issues quickly.
Okay
Another tool that provides insights into your team's performance and code quality is called Okay. It analyzes data from your code repository, build tools, and other sources to help you identify areas for improvement and optimize your team's performance.
Okay's best features are its ability to provide data-driven insights in real-time, valuable metrics such as code quality, test coverage, and deployment frequency, customizable dashboards, and, similarly to Sleuth, its integration with popular DevOps tools.
Waydev
And lastly, Waydev also helps to boost your team's productivity and code quality by analyzing data from your code repository, project management tools, and other sources with features like pre-built widgets, team performance metrics such as sprint velocity and team throughput, and analytics on your Git repository, including commit frequency, branch activity, and code churn.

Factors that impact engineering team performance
There are five crucial factors affecting the performance of engineering teams in general:
- Team structure. Teams with clear roles, responsibilities, and communication channels tend to be more productive and efficient.
- Workload and capacity. Workload refers to the amount of work needed, while capacity refers to the amount that a team or individual can handle within a given time frame. It is essential to balance the two to avoid burnout, stress, and missed deadlines.
- Communication and collaboration. Collaborating effectively allows team members to leverage each other's strengths, share knowledge and expertise, and achieve better results than they could individually.
- Leadership and management. Good leaders set clear goals, provide guidance, and inspire their team members to achieve their best work. They also create a positive team culture that promotes collaboration, creativity, and continuous improvement.
- Culture and values. A positive team culture that promotes collaboration, creativity, and innovation can foster a sense of purpose and motivation among team members. It can also attract and retain top talent, as employees tend to be drawn to companies that share their values and beliefs.
Want to have an efficient, business-oriented design?
View a recorded webinar with Pavel Tseluyko on how design adds value to your business.
Watch nowSummary
Overall, performance metrics and KPIs have become increasingly important in engineering in recent years due to the complexity and scale of modern engineering projects. Teams need to measure their progress and success in a quantifiable way, and performance metrics and KPIs provide a way to do this.
However, the key to success in engineering teams is to strike a balance between driving performance and fostering a positive and supportive work environment. By focusing on both metrics and individual development and by creating a culture of collaboration and open communication, engineering teams can achieve great things and drive innovation in their respective fields. Good luck!